ZP-RECORDER Force Data Analysis Software
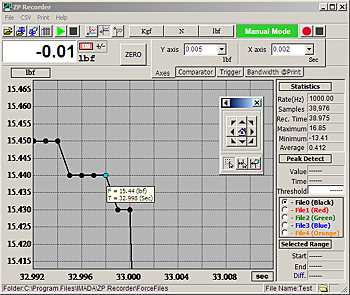
ZP Recorder force data analysis software is designed to interface with Imada ZP and ZPH Series (USB) force gauges to record and process the 1,000 data per second transmitted by the gauge. Each data point incorporates both a force and time value, so force profiles can be analyzed for much more than just the peak. Set units of measurement and zero the gauge from the software. Record in either Manual or Automatic modes. Automatic mode can be configured to save data for both destructive and nondestructive testing.
Force Data Analysis ToolsThe recorded data is displayed as a graph and statistics are automatically generated. Zoom into any part of the graph to examine individual data points at intervals of 1mS. Mouse over any data points to display the force and time values. Further data analysis can be done by selecting part of the graph to generate statistics for that time interval. Detect the first peak for a specific threshold for the whole graph or just a part of it. Compare and align multiple graphs which are color-coded for clear display. Save graphs or export data to CSV format.

ZP Recorder offers new tools to users requiring the latest advancements in force data analysis.
Hardware/Software RequirementsPC: Pentium II 400MHz or equivalent with USB portOperating System: Microsoft Windows NT, 2000, XPGauge: ZP, ZPH and ZPS
Features
- Process 1,000 data/second not just the peak
- Zoom in to examine important details
- Select part of the graph
- Generate statistics for all or part of the graph
- Detect first peak
- Compare and align multiple graphs
- Export data as CSV
Related Products
Buy Now
Availability: Available: 1 - 3 days, Delivery time: 1 - 3 weeks, special order request

